- Completed $378 million IPO on the NYSE on October 14, 2021
- Revenue increased 12.1% (or 14.5% organically) to $415.6 million
- Cash from operations was $190.2 million
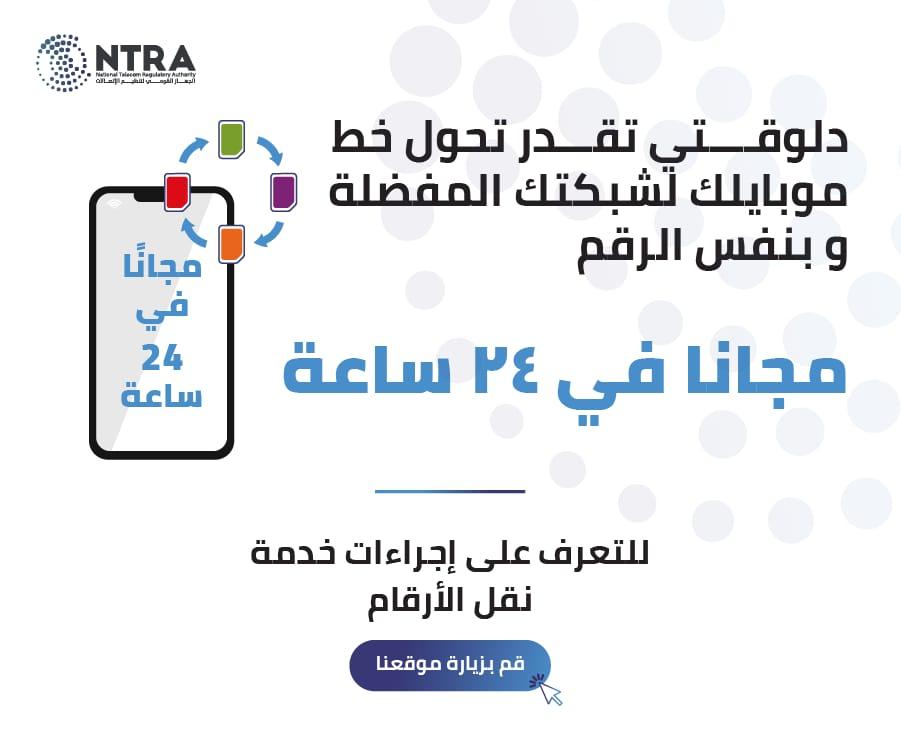
- Signed a partnership agreement with Egypt Digital Company for Investment S.A.E. to obtain a license from the National Telecom Regulatory Authority (“NTRA”) to construct, operate and lease telecom towers in Egypt
By : Bakinam Khaled
IHS Holding Limited (NYSE: IHS) (“IHS Towers” or the “Company”), one of the largest independent owners, operators and developers of shared telecommunications infrastructure in the world by tower count, today reported financial results for the fourth quarter and full year ended December 31, 2021.
Sam Darwish, IHS Towers Chairman and Chief Executive Officer, stated, “I am pleased to be reporting our results today for the fourth quarter and full year 2021, as IHS delivered continued, strong financial and operational performance while accomplishing many actions that further strengthen our position.
In addition to listing on the New York Stock Exchange in October, IHS executed a $1 billion bond offering and refinancing, entered the Egyptian market through a licensed partnership, closed the TIM Fiber transaction to create I-Systems, a leading fiber company in Brazil, and announced agreements to acquire MTN’s portfolio of 5,709 towers in South Africa, which we expect will make IHS the leading independent tower company in South Africa upon closure.
We ended 2021 as the fourth largest independent multinational tower company with over 31,000 towers spanning nine countries on three continents and, in January 2022, we announced the acquisition of the GTS SP5 portfolio of 2,115 towers in Brazil, after which IHS will become the third largest towerco in Brazil. I am delighted to say that, following consummation of the South African and GTS acquisitions, IHS will become the third largest independent multinational towerco globally by tower count, with over 38,000 towers.
As we have shown, we have deepened our commitment to Africa while also pursuing our diversification strategy, building upon our entrance into Latam and the Middle East, and continuing our strong investment in organic growth, including in ancillary technologies such as small cells, DAS and fiber. We remain excited about the digital infrastructure opportunities available to us in emerging markets, where our critical infrastructure and approach to sustainability helps connect underserved communities to bridge the digital divide. We look forward to more opportunities in 2022 as several of our key markets such as Brazil and Nigeria begin to rollout 5G technologies.”
RESULTS FOR THE FOURTH QUARTER AND FULL YEAR 2021
The table below sets forth select financial results for the quarters ended December 31, 2021 and December 31, 2020 and financial results for the full years ended December 31, 2021 and December 31, 2020:
|
|
|
|
|
|
|
|
|
|
|
|
|
|
|||||
|
|
|
Three months ended |
|
|
Twelve months ended |
||||||||||||
|
|
|
Dec 31, |
|
|
Dec 31, |
|
Y on Y |
|
|
Dec 31, |
|
|
Dec 31, |
|
|
Y on Y |
|
|
|
|
2021 |
|
|
2020 |
|
Growth |
|
|
2021 |
|
|
2020 |
|
|
Growth |
|
|
|
|
$’000 |
|
|
$’000 |
|
% |
|
|
$’000 |
|
|
$’000 |
|
|
% |
|
|
|
|
|
|
|
|
|
|
|
|
|
|
|
|||||
|
Revenue |
|
415,614 |
|
|
370,727 |
|
12.1 |
|
|
1,579,730 |
|
|
1,403,149 |
|
|
12.6 |
|
|
(Loss)/profit for the period |
|
(72,280 |
) |
|
50,230 |
|
(243.9 |
) |
|
(26,121 |
) |
|
(322,682 |
) |
|
(91.9 |
) |
|
Adjusted EBITDA(1) |
|
216,649 |
|
|
214,674 |
|
0.9 |
|
|
926,396 |
|
|
819,014 |
|
|
13.1 |
|
|
Cash from operations |
|
190,184 |
|
|
139,613 |
|
36.2 |
|
|
788,073 |
|
|
656,699 |
|
|
20.0 |
|
|
RLFCF(1) |
|
87,902 |
|
|
147,723 |
|
(40.5 |
) |
|
406,160 |
|
|
374,842 |
|
|
8.4 |
|
(1) Adjusted EBITDA and RLFCF are non-IFRS financial measures. See “Use of Non-IFRS Financial Measures” for additional information and a reconciliation to the most comparable IFRS measures.
The financial results for the quarters ended December 31, 2021 and December 31, 2020 and the financial results for the full year ended December 31, 2021 are unaudited. The financial results for the full year ended December 31, 2020 are extracted from the audited financial statements for the year then ended.
Overview
In January 2021, March 2021 and April 2021 we closed and integrated the Skysites Acquisition, Centennial Colombia acquisition and the Centennial Brazil acquisition, respectively. In April 2021 and October 2021, we closed the third and fourth phase of the Kuwait Acquisition, respectively. In October 2021 we listed on the NYSE and entered the Egyptian market through a licensed partnership. In November 2021, the Company closed its previously announced transaction with TIM S.A. (“TIM”) to acquire a controlling interest in FiberCo Soluções de Infraestrutura S.A. (“I-Systems”) and signed agreements to purchase 5,709 towers from MTN in South Africa.
During 2020, we closed the CSS Acquisition in February 2020 and the Kuwait Acquisition, in which the first phase closed in February 2020 followed by the second phase in October 2020. Both acquisitions were fully integrated. In 2020, we also amended the contracts with two of our key customers with respect to currency conversion provisions.
Results/comparison of three months ended December 31, 2021 versus 2020
During the fourth quarter of 2021, revenue was $415.6 million compared to $370.7 million for the fourth quarter of 2020, an increase of $44.9 million, or 12.1%. Organic growth was $53.6 million, or 14.5%. Organic growth was driven primarily by escalations, lease amendments and foreign exchange resets, as well as new sites and new colocations. Aggregate inorganic revenue was $11.9 million for the three month period ended December 31, 2021. The increase in organic revenue in the period was partially offset by a negative 5.6% movement in foreign exchange rates of $20.6 million.
Loss for the period was $72.3 million for the fourth quarter of 2021 compared to profit of $50.2 million for the fourth quarter of 2020. The loss for the period reflects the aggregate impact of the increase in revenue discussed above offset by an increase in cost of sales and administrative expenses resulting from incremental costs associated with our transition to public company status and also higher power generation costs. It is further impacted by an increase in net finance costs of $176.4 million, set off by a decrease in total tax expense.
Adjusted EBITDA was $216.6 million for the fourth quarter of 2021 compared to $214.7 million for the fourth quarter of 2020. Adjusted EBITDA margin for the fourth quarter of 2021 was 52.1%. The increase in Adjusted EBITDA primarily reflects the aggregate impact of the increase in revenue discussed above partially offset by increases in cost of sales and administrative expenses resulting from incremental costs associated with our transition to public company status and also higher power generation costs.
Cash from operations and RLFCF for the fourth quarter of 2021 were $190.2 million and $87.9 million, respectively, compared to $139.6 million and $147.7 million, respectively, for the fourth quarter of 2020. The increase in cash from operations primarily reflects the aggregate impact of the increase in revenue discussed above partially offset by increases in cost of sales and administrative expenses. The decrease in RLFCF is due to the increase in cash from operations offset by higher withholding tax from revenue growth in Nigeria, higher lease payments to support growth, higher taxes due to expiring tax credits and increased interest expense.
Segment results
Revenue:
Revenue for each of our reportable segments was as follows:
|
|
|
Three months ended |
|
|
|
|
|
||
|
|
|
Dec-31 |
|
Dec-31 |
|
|
|
|
|
|
|
|
2021 |
|
2020 |
|
Change |
|
Change |
|
|
|
|
$'000 |
|
$'000 |
|
$'000 |
|
% |
|
|
|
|
|
|
|
|
|
|
|
|
|
Nigeria |
|
299,792 |
|
273,069 |
|
26,723 |
|
9.8 |
% |
|
Sub-Saharan Africa |
|
87,563 |
|
82,127 |
|
5,436 |
|
6.6 |
% |
|
MENA |
|
8,196 |
|
6,663 |
|
1,533 |
|
23.0 |
% |
|
Latam |
|
20,063 |
|
8,868 |
|
11,195 |
|
126.2 |
% |
|
Total revenue |
|
415,614 |
|
370,727 |
|
44,887 |
|
12.1 |
% |
Nigeria
Revenue for our Nigeria segment increased by $26.7 million, or 9.8%, to $299.8 million for the three-month period ended December 31, 2021, compared to $273.1 million for the three-month period ended December 31, 2020. Year-on-year revenue for the three-month period ended December 31, 2021 increased organically by $46.6 million, or 17.1%, driven by an increase in Tenants of 787, which includes Tenants from 317 net new sites, from 8,986 Lease Amendments added and from increases through contractual CPI escalations and foreign exchange reset mechanisms.
Aggregate increases of $46.6 million in organic revenue were partially offset by the impact of negative movements in the Naira to U.S. dollar foreign exchange rate of $19.9 million.
Sub-Saharan Africa
Revenue for our Sub-Saharan Africa segment increased by $5.4 million, or 6.6%, to $87.6 million for the three-month period ended December 31, 2021, compared to $82.1 million for the three-month period ended December 31, 2020. Revenue increased organically by $4.5 million, or 5.5%, driven by increases through contractual CPI escalations and foreign exchange reset mechanisms, and the addition of 155 Lease Amendments, partially offset by a net decrease in Tenants of 207, which includes the impact of net Churn of 832 Tenants not relating to Key Customers, and the impact of a net increase in new sites of 251. Revenue for our Sub-Saharan Africa segment also grew inorganically in the period by $1.4 million from the acquisition of a tower portfolio in Rwanda in April 2021 which resulted in 162 additional towers and 283 additional Tenants. Revenue in the period was partially offset by the year-on-year negative impact of movements in foreign exchange rates of $0.5 million or 0.5%.
MENA
Revenue for our MENA segment increased by $1.5 million, or 23.0%, to $8.2 million for the three-month period ended December 31, 2021, compared to $6.7 million for the three-month period ended December 31, 2020. The number of towers in our MENA segment increased by 240, 193 of which are related to the third and fourth phases of the Kuwait acquisition which occurred in April and October 2021 respectively, with the remaining 47 being new sites. Revenue in our MENA segment for the three-month period ended December 31, 2021, did not reflect significant organic growth, and grew inorganically in the period by $1.2 million, or 17.4%. Revenue in the period also grew year-on-year by $0.1 million, or 1.1% as a result of year-on-year positive impact of movements in foreign exchange rates.
Latam
Revenue for our Latam segment increased by $11.2 million, or 126.2%, to $20.1 million for the three-month period ended December 31, 2021, compared to $8.9 million for the three month period ended December 31, 2020. Revenue increased organically by $2.2 million, or 24.8%, driven by a net increase in Tenants of 710, which includes the impact of a net increase in new sites of 604, and from increases through contractual CPI reset mechanisms. Revenue for our Latam segment grew inorganically in the period by $9.4 million, or 105.4%, which primarily includes the impact of 1,824 Towers and 2,006 Tenants added through the Skysites acquisition and the Centennial acquisitions in Columbia and Brazil, respectively, and revenue from our newly acquired fiber business, I-Systems. The growth was partially offset year-on-year by $0.4 million, or 4.0% as a result of the year-on-year negative impact of movements in foreign exchange rates.
Segment Adjusted EBITDA:
Segment Adjusted EBITDA, our key profitability measure used to assess the performance of our reportable segments, for each of our reportable segments was as follows:
|
|
|
Three months ended |
|
|
|
|
|
|
|
||||
|
|
|
Dec-31 |
|
|
Dec-31 |
|
|
|
|
|
|
|
|
|
|
|
2021 |
|
|
2020 |
|
|
Change |
|
|
Change |
|
|
|
|
|
$'000 |
|
|
$'000 |
|
|
$'000 |
|
|
% |
|
|
|
|
|
|
|
|
|
|
|
|
|
||||
|
Nigeria |
|
183,862 |
|
|
177,876 |
|
|
5,986 |
|
|
3.4 |
|
% |
|
Sub-Saharan Africa |
|
46,154 |
|
|
46,692 |
|
|
(538 |
) |
|
(1.2 |
) |
% |
|
MENA |
|
3,684 |
|
|
3,260 |
|
|
424 |
|
|
13.0 |
|
% |
|
Latam |
|
13,546 |
|
|
6,702 |
|
|
6,844 |
|
|
102.1 |
|
% |
|
Other |
|
(30,597 |
) |
|
(19,856 |
) |
|
(10,741 |
) |
|
54.1 |
|
% |
|
Total Segment Adjusted EBITDA |
|
216,649 |
|
|
214,674 |
|
|
1,975 |
|
|
0.9 |
|
% |
Nigeria
Segment Adjusted EBITDA for our Nigeria segment was $183.9 million for the three month period ended December 31, 2021 compared to $177.9 million for the three month period ended December 31, 2020, an increase of $6.0 million, or 3.4%. The year-on-year increase is primarily due to an increase of $26.7 million of aggregate revenue and a $4.6 million decrease in administrative expenses included within Segment Adjusted EBITDA for the three month period ended December 31, 2021. This was offset by an increase in power generation cost of sales of $19.4 million and an increase in other cost of sales of $5.9 million.
Sub-Saharan Africa
Segment Adjusted EBITDA for our Sub-Saharan Africa segment was $46.2 million for the three month period ended December 31, 2021 compared to $46.7 million for the three month period ended December 31, 2020, a small decrease of $0.5 million. The decrease is primarily due to an increase in revenue of $5.4 million, offset by an increase in regulatory permits and power costs of $3.2 million and $1.1 million, respectively and other cost of sales of $1.6 million.
MENA
Segment Adjusted EBITDA for our MENA segment was $3.7 million for the three month period ended December 31, 2021 compared to $3.3 million for the three month period ended December 31, 2020, an increase of $0.4 million, or 13.0%. The increase is primarily due to an increase in revenue, partially offset by an increase in cost of sales included within Segment Adjusted EBITDA of $0.9 million, and an increase in administrative expenses included within Segment Adjusted EBITDA of $0.2 million.
Latam
Segment Adjusted EBITDA for our Latam segment was $13.5 million for the three month period ended December 31, 2021 compared to $6.7 million for the three month period ended December 31, 2020, an increase of $6.8 million, or 102.1%. The increase is primarily due to an increase in revenue, partially offset by an increase in cost of sales included within Segment Adjusted EBITDA of $1.2 million, and an increase in administrative expenses included within Segment Adjusted EBITDA of $3.2 million mainly as a result of an increase in staff costs and professional fees.
Results/comparison of twelve months ended December 31, 2021 versus 2020
During the twelve months ending December 31, 2021, revenue was $1,579.7 million compared to $1,403.1 million for the twelve months ending December 31, 2020, an increase of $176.6 million, or 12.6%. Organic growth was $226.6 million, or 16.1%. Organic growth was driven primarily by escalations, lease amendments and foreign exchange resets, as well as new sites and new colocations. Aggregate inorganic revenue was $34.0 million for the twelve month period ended December 31, 2021. The increases in organic revenue in the period were partially offset by a negative 6.0% movement in foreign exchange rates of $84.0 million.
Loss for the period was $26.1 million for the twelve months ending December 31, 2021, compared to $322.7 million for the twelve months ending December 31, 2020, a decrease in loss of $296.6 million for the period, of which $176.6 million was due to year-on year increase in revenue, offset by an increase in cost of sales and administrative expenses resulting from incremental costs associated with our transition to public company status and also higher power generation costs. The decrease in loss was due to a reversal of allowance for trade receivables, an aggregate decrease in net finance costs, and a decrease in total tax expense.
Adjusted EBITDA was $926.4 million for the twelve months ending December 31, 2021, compared to $819.0 million for the twelve months ending December 31, 2020. Adjusted EBITDA margin for the twelve months ending December 31, 2021, was 58.6%, compared to 58.4% for the twelve months ending December 31,2020. The increase in Adjusted EBITDA primarily reflects the increase in revenue offset with year-on-year increase in cost of sales mainly due to higher power generation costs. The increase was also due to a decrease in administrative costs mainly due to a reversal of allowance for trade receivables.
Cash from operations and RLFCF for the twelve months ending December 31, 2021, were $788.1 million and $406.2 million, respectively, compared to $656.7 million and $374.8 million, respectively, for the twelve months ending December 31, 2020. The increase in cash from operations primarily reflects the aggregate impact of the increase in revenue discussed above and increases in cost of sales and administrative expenses. The increase in RLFCF is due to the increase in cash from operations offset by higher withholding tax from revenue growth in Nigeria, higher lease payments to support growth, higher taxes due to expiring tax credits and increased interest expense.
INVESTING ACTIVITIES
During the fourth quarter of 2021, capital expenditures were $150.6 million compared to $65.3 million for the fourth quarter of 2020. The increase is primarily driven by the Nigeria segment, with an increase in fiber business capital expenditures of $14.5 million, increase in maintenance capital expenditures of $23.9 million, and an increase in other expenditures of $22.7 million, offset by a decrease in augmentation capital expenditures of $15.3 million, year-on-year for the three month period ended December 31, 2021. The increase is also due to the Latam segment, with an increase of $23.3 million mainly relating to the newly acquired fiber operations.
On October 4, 2021, the Company signed a partnership agreement with Egypt Digital Company for Investment S.A.E., an investment vehicle of the Egyptian Ministry of Communications, to form a joint venture, IHS Telecom Towers Egypt S.A.E., or IHS Egypt, to obtain a license from the National Telecom Regulatory Authority (“NTRA”) to construct, operate and lease telecom towers in Egypt. Under the terms of the license, and subject to the fulfillment of certain conditions, IHS Egypt will have a commitment to a coverage plan of 5,800 sites over a three-year period. IHS Towers will own 80% of IHS Egypt and Egypt Digital Company for Investment will own the remaining 20%.
On November 16, 2021, the Company closed its previously announced transaction with TIM S.A. to acquire a controlling interest in I-Systems. This includes TIM’s secondary fiber network and assets as well as the provision of fiber optic infrastructure services as an Open Fiber Network Service Provider. Under the agreements, IHS Towers owns, through one of its Brazilian subsidiaries, a 51% stake and TIM owns the remaining 49%.
On November 17, 2021, the Company signed an agreement with Mobile Telephone Networks Proprietary Limited (“MTN South Africa”) to acquire its tower portfolio comprising 5,709 towers and for the provision of power services to MTN South Africa at approximately 13,000 sites (including the acquired sites). The portfolio of 5,709 sites currently has a colocation rate of 1.2x. Under the terms of the agreement, MTN South Africa will also provide a multi-year commitment for a portion of its new towers to be built by the Company. The consideration is ZAR6.4 billion on a debt-free and cash-free basis subject to customary post-closing price adjustments. The transaction will be financed through a combination of cash on hand and / or drawing on available facilities. The transaction is expected to close in the first or second quarter of 2022 subject to customary regulatory approvals and closing conditions. The Group expects to account for its acquisition as a business combination under IFRS 3.
On January 21, 2022, the Company (via its subsidiary IHS Brasil – Cessão de Infraestruturas S.A.) signed an agreement to acquire 100% of São Paulo Cinco Locação de Torres Ltda. (“SP5”), a Grupo Torresur (“GTS”) portfolio company. The SP5 portfolio includes 2,115 towers across Brazil. The purchase price of the transaction, on a cash and debt free basis, is $315 million. The Group expects to account for this acquisition as a business combination under IFRS 3. The transaction is expected to close imminently.
FINANCING ACTIVITIES AND LIQUIDITY
Approximate U.S. dollar equivalent values for non-USD denominated facilities stated below are translated from the currency of the debt at the relevant exchange rates on December 31, 2021.
The Group ended the fourth quarter and full year of 2021 with $2,985.2 million of total debt and $916.5 million of cash and cash equivalents.
Initial Public Offering: On October 14, 2021, we completed our initial public offering (“IPO”) by issuing 18,000,000 ordinary shares at a price to the public of $21 per share, resulting in gross proceeds to us of $378 million.
IHS Holding Dual Tranche Senior Notes: IHS Towers issued dual tranche senior notes of $500 million 5.625% Senior Notes due 2026 (the “2026 Notes”) and $500 million 6.250% Senior Notes due 2028 (the “2028 Notes” and, together with the 2026 Notes, the “Notes”), in each case at an issue price of 100.000% plus accrued interest, if any, from the Issue Date of November 29, 2021. The Company used or will use the gross proceeds of the Offering to redeem in full its 2025 Notes, for fees and expenses in connection with the offering and related transactions and for general corporate purposes. The 2027 Notes issued in September 2019 are still outstanding. These Notes may however be redeemed at an earlier date pursuant to their terms at the discretion of the company.
IHS Holding Revolving Credit Facility: As previously reported, the commitments under the Restated IHS Holding Revolving Credit Facility were increased by $25 million to $270 million in October 2021. The Restated IHS Holding Revolving Credit Facility will terminate in March 2023 unless further extended in accordance with its terms for successive 12-month periods up to and including March 2025. As of December 31, 2021, the Restated IHS Holding Revolving Credit Facility was undrawn and had $270 million in available borrowing capacity, which could be increased to up to $300 million.
Full Year 2022 Outlook Guidance
The following full year 2022 guidance is based on a number of assumptions that management believes to be reasonable and reflect the Company’s expectations as of March 15, 2022. Actual results may differ materially from these estimates as a result of various factors, and the Company refers you to the cautionary language regarding “forward-looking” statements included in this press release when considering this information. The Company’s outlook includes the impact of the GTS acquisition from Q2 onwards but does not include any impact from the MTN South Africa acquisition or the newly established Egypt operations.
The Company’s outlook is based on the following assumptions:
- average foreign currency exchange rates to 1.00 U.S. Dollar for January 1, 2022 through December 31, 2022 for key currencies: (a) 439 Nigerian Naira; (b) 5.70 Brazilian Real (c) 0.87 Euros
- Oil assumed at $99 USD/bbl in Q1, 2022 and $120 USD/bbl in Q2-Q4 2022
- Build-to-suit of circa 2,350 sites of which ~1,250 sites in Nigeria and ~700 sites in Brazil
|
|
|
|
|
Metric |
|
Range |
|
Revenue |
|
$1,795M – $1,815M |
|
Adjusted EBITDA (1) |
|
$960M – $980M |
|
Recurring Levered FCF (1) |
|
$310M – $330M |
|
Total Capex |
|
$500M – $540M |
(1) Adjusted EBITDA and RLFCF are non-IFRS financial measures. See “Use of Non-IFRS Financial Measures” for additional information and a reconciliation to the most comparable IFRS measures. We are unable to provide a reconciliation of Adjusted EBITDA and RLFCF to (loss)/profit and cash from operations, respectively, for the periods presented above without an unreasonable effort, due to the uncertainty regarding, and the potential variability, of these costs and expenses that may be incurred in the future, including, in the case of Adjusted EBITDA, share-based payment expense, finance costs, and insurance claims, and in the case of RLFCF net movement in working capital, other non-operating expenses, and impairment of inventory.